Reviews
Part of No Shortcuts Here: Marketing Report Is Decided by the Basics
Settling on Marketing Report Templates Without Wasted Steps
how to create marketing report templates by auditing decisions, defining metric contracts, prototyping narratives, testing data quality, and governing releases.
What to take away
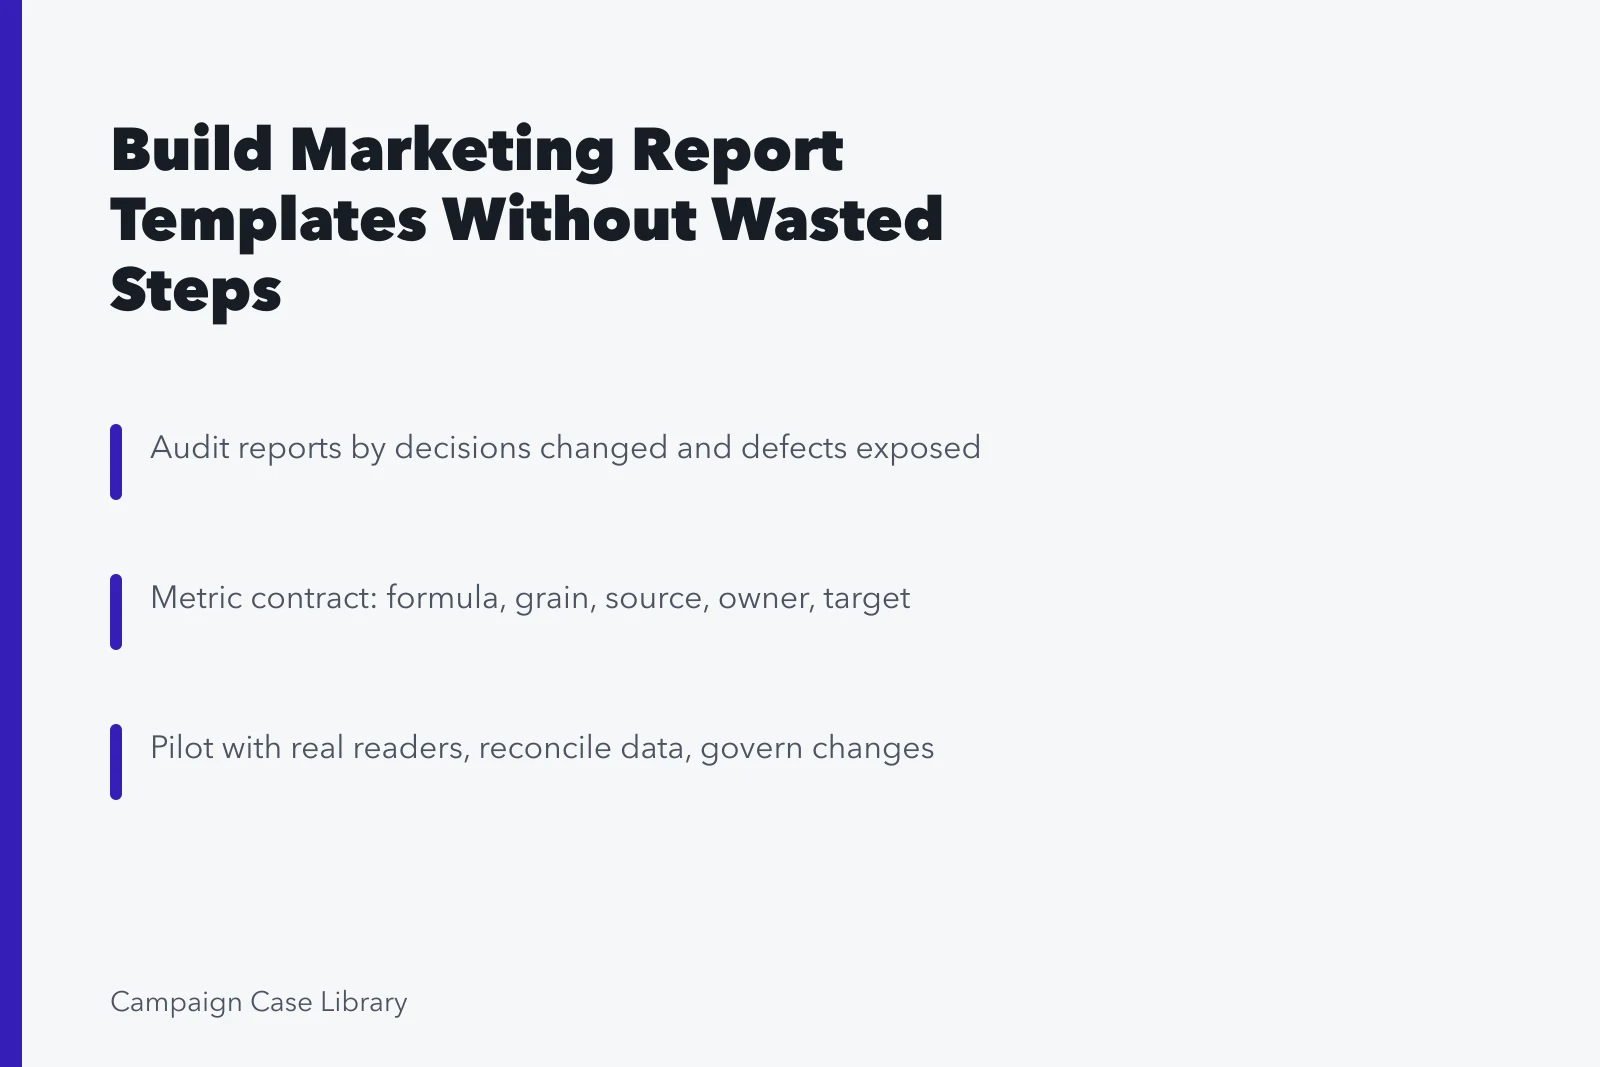
- Audit current reports by the decisions they changed, the defects they exposed, and the recurring work or confusion they created.
- Create a metric contract before designing charts: meaning, formula, scope, source, grain, quality, attribution, owner, target, and revision behavior.
- Pilot the report with real readers, reconcile the data, test accessible exports, and govern changes to definitions, sources, layout, and access.
How to create marketing report templates begins with recurring decisions, not available charts. Map who reads the report, what each person can change, which evidence supports that decision, and how quickly it must arrive.
Audit current reporting
Inventory reports, dashboards, exports, spreadsheets, meetings, metrics, owners, and recipients. Find duplicate definitions, manual work, unused pages, late data, unexplained revisions, inaccessible visuals, and recurring disputes. Observe a real review meeting rather than relying on stated preferences.
Create the decision map
For each cadence, record objective, decision, threshold, owner, deadline, supporting metrics, and action process. Separate live monitoring, weekly optimization, monthly performance, quarterly strategy, and formal disclosure: each needs different latency, confidence, and governance.
Build the metric contract
Define formula, population, grain, unit, time zone, currency, source, filters, attribution, owner, baseline, target, refresh, and limitation. Reconcile with finance, sales, product, and operations. Baselines and targets are set upstream, in the marketing plan templates the team already approved. Freeze approved definitions for the reporting cycle and log any break in series.
Prototype the narrative
Google Analytics' detail-report documentation describes a report with summary charts, a detailed table, filters, data-quality indicators, date comparisons, sharing, and export. Use those components as testable examples, not as a required structure for every organization.
Start with a plain document or sketch: decision summary, objectives, primary outcomes, diagnostics, economics, findings, limitations, and actions. Test whether readers can explain the conclusion without the author. Add automation only after the questions and definitions survive a real cycle.
Engineer quality checks
The W3C Web Accessibility Initiative's accessible-tables tutorial explains how captions, marked header cells, and explicit row or column relationships help users interpret data tables and warns that conversion can lose table structure. Apply the relevant technique to the actual web, document, or export format.
Validate completeness, duplicates, ranges, currencies, dates, joins, source totals, and expected freshness. Because recent data can change during processing, show the data-through time, preliminary status, and expected revision window. Assign thresholds, exception owners, and restatement rules.
Pilot and govern
Run parallel with the existing report for one or two cycles. Track production time, discrepancies, reader questions, action completion, and accessibility failures. Then publish a controlled master, metric dictionary, data map, usage guide, owner, change log, access model, and review date.
Remove charts that do not support a decision or diagnosis. Most of these reports are read aloud in meetings, where marketing presentation templates take over.
Preserve underlying data and a text explanation so results stay reviewable when tools, staff, and platform definitions change. Schedule a definition review before every reporting year, and whenever a source, owner, objective, or recurring decision changes.
Report-template creation sequence
| Stage | Output | Failure to prevent |
|---|---|---|
| Audit | Decision map and defect record | Rebuilding unused reporting |
| Contract | Definitions, sources, owners, limits | Metric drift and false comparison |
| Prototype | Narrative, detail, action path | Charts without decisions |
| Pilot and govern | Reconciled release and change control | Unreviewed recurring errors |
Run a controlled handoff
The GOV.UK technology selection guidance recommends adaptable choices, data control, security review, and ownership-cost analysis. Use those questions when assessing the tool, not as endorsements. The pages a master keeps are set out in the marketing report template sections.
The CISA software acquisition fact sheet covers development practice, supply-chain exposure, and vulnerability management. Add those questions to the review, not as approval.
Common questions
How many old reports should be audited?
Use a varied sample across audiences, cadences, channels, and known failures until recurring patterns become clear, then record its limits.
Who should define a marketing metric?
Assign one accountable owner, with input from source-system, finance, privacy, and business owners when the measure crosses their responsibilities.
What should a pilot test?
Test comprehension, reconciliation, refresh, accessibility, export, action ownership, production time, and whether the report changes a defined decision.